Spatial relationships have been and always will be a relevant part of life; any piece of data which can be observed in space and time can be mapped and visualized. This geospatial data is typically stored in one of two forms: raster and vector.
Raster data is organized as a grid, every square of which is consistent in size and tied to a geographical reference point in space at a specific time. Geographic data of this type is often multispectral or hyperspectral imagery acquired via aircraft or satellite (think of an aerial map). The terms Multi- and hyperspectral refer to the number of slices (“bands”) of the electromagnetic spectrum recorded within each pixel. Multispectral imagery generally contains 3-10 bands, while hyperspectral imagery can have hundreds or even thousands of bands recorded for each pixel. Raster data is recorded as “brightness values” of regions of the electromagnetic spectrum observed reflecting and/or emitting from the surface of the target object/area. Digital images recorded using one’s phone camera are an example of what is known as “multispectral” raster data. Within this example, each individual raster cell (“pixel”) contains values for Red, Green, and Blue, which when observed together display a single color. This is known as “additive color theory.” Precision Agriculture is a modern practice which employs the usage of hyperspectral imagery to derive information about vegetation performance, which is used to pivot management practices, such as modifying nutrient application, to ultimately enhance crop production.
The other type of mappable data consists of “vectors.” While raster data is stored as gridded values with consistent pixel resolution, vector data consists of shapes: points, lines, and polygons. These geometric features are also geographically referenced in space and, application depending, over a duration of time. Vectors can represent existing (or proposed) real-life features such as roads, buildings, property lines, census tracts, and others.
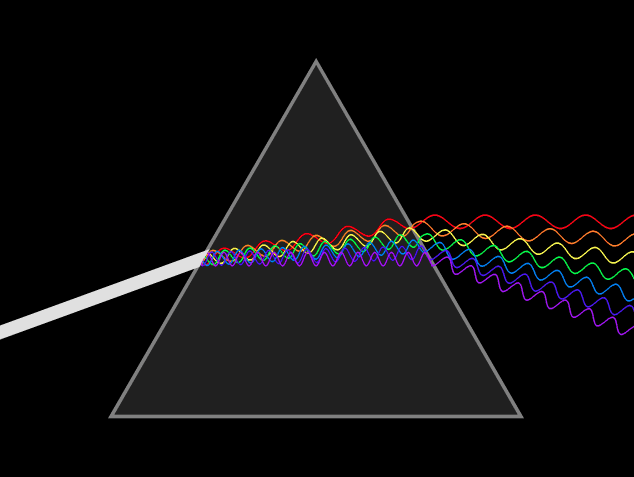
Electromagnetic radiation (EMR) refers to the waves of the electromagnetic field as they move through space and time. An example of this radiation is “(white) light”, which is visible to the human eye, and part of the electromagnetic spectrum within the wavelengths of ~400-700 nanometers, and represents only a very small portion of the entire electromagnetic spectrum. While humans can only “see” a small region of the electromagnetic spectrum, electronic sensors can detect a far greater range; this information can be used to indicate countless metrics, such as vegetation health (NDVI) or surface features and RADAR (LiDAR). Directly relevant to geospatial mapping applications, this type of information is typically stored in “raster” form.
Vector and raster data types are often used together to create an even deeper representation of the project at hand, like removing pixels outside a region of interest. For example, if one is observing crop performance within a defined area of a field, one can apply a vector of the area to a raster of the larger area and clip that raster down for various plot-based analytics.
Various applications of mapping play an integral role in modern-day society, and those applications are broadening every day. When a road is to be built, land rights must be considered; or combining demographic information with sales history for a retailer to open a new location and forecast the most profitable pricing schedule for their products.