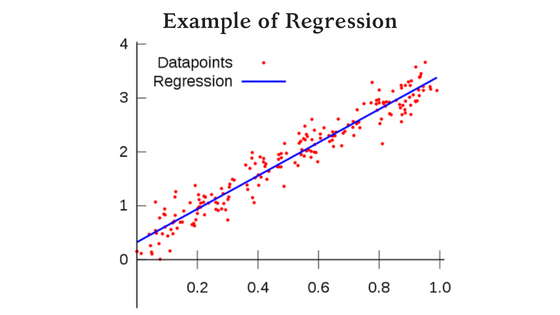
When it comes to analyzing data there are a variety of methods that can be used. But most applications of data analytics today fall under one of two categories: regression and classification. Regression is the process of using past data to predict the future value of a continuous numerical variable. This can include anything from predicting a stock’s price next week to predicting how many people will be infected by an epidemic.
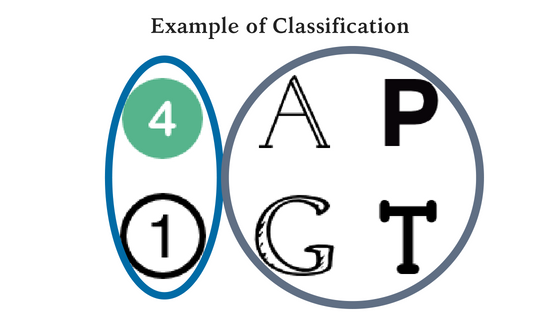
Classification, on the other hand, is the process of using past data to place data points into discrete categories. An example is choosing what advertisements to show people online based on their browsing history.
The regulatory space typically demands an interesting mix of both classification and regression. The final goal of a regulatory analytics model is generally a classification. This can mean classifying a business as “low risk” or “high risk” or defining certain behaviors as “money laundering” or “product diversion.” Getting to the point of classification, however, can be quite a bit more challenging than it is in other fields.
Going back to the ad example, an ad agency may have data of a million consumer profiles containing their demographics, browsing preferences, and whether or not they bought a product. They can say for certain that Jim, a 20-year-old from New York City who checks ESPN every day, bought a Knicks jersey when he saw the ad for it. With this knowledge, the agency can make better predictions as to who else is likely to buy that same jersey if shown the ad.
The certainty of past events is a luxury the regulatory space does not often have. A regulator may have millions of data points about past marijuana sales, but these data points don’t come with any prepackaged category or risk level. As nice as it would be, a dispensary that reports a sale of an ounce of marijuana for a penny does not label the transaction as having a “high risk of tax evasion.”
This leaves regulatory analysts with the task of classifying data points into categories for which they don’t always have prior comparable examples. This task often starts with the fitting of a regression model to data for the prediction of a certain variable. Outliers, or data points that fall far from the expected value, may be classified as risky. Any description of the nature of the risk, however, must come from the judgement of the analyst. Looking back to the marijuana example, a model may predict the price of the ounce to be $150. A reported sale of that product at a cent and one at $10,000 are both outliers. It is up to the analyst to be able to use prior industry knowledge to classify the former as “tax evasion” and the latter as “money laundering.”