The NCS Platform takes in hundreds of thousands of data points on a daily basis. The analytics engine identifies transactions that fall outside of the statistical norms in order to alert our clients about unusual activity. How do we know these are really atypical transactions, you ask?
One way that we distinguish the “normal” from the “abnormal” is by using a common statistical term called the Normal Distribution, also known as the Bell Curve. The bell curve is evident around the globe in a variety of scenarios such as:
- Heights
- Test scores in school
- Blood Pressure
In the Platform, this is one of the ways we can look at cannabis products, but it may be better explained with something we can all relate to, like height.
Across the country and world, there are people of all heights. Through data collected over the years, the average adult male height was determined to be 70 inches, or 5’10, while the average adult female height was determined to be 65 inches, or 5’5. The data also shows a standard deviation of 4 inches for males and 3.5 inches for females; a standard deviation is how spread out the other data points are from the average. As you can see in the graph, 68% of all data points sit within the standard deviation- so for height in adult males, 68% are within 4 inches of 5’10.
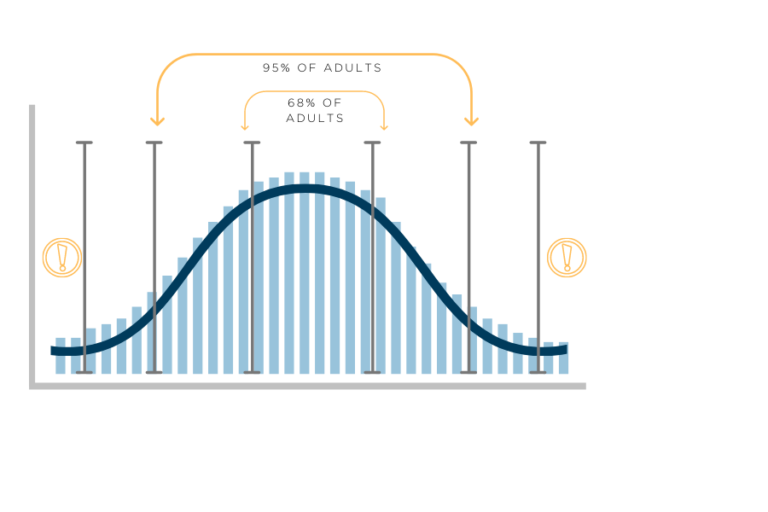
If you move to two standard deviations of all data points, it includes 95% of all adult males. Any results outside of three standard deviations would mean a data point that is very unlikely to occur- or you can think of it this way:
- 68 out of 100 are likely to be within 1 standard deviation
- 95 out of 100 are very likely within 2 standard deviations
- 997 out of 1000 are almost certainly within 3 standard deviations
Heights that fall outside of three standard deviations are considered outliers, similar to what we see in the NCS Platform. Much like a person who is 7 feet tall would be considered an outlier, our analytics engine determines outliers such as a purchase of 1 gram of cannabis for $1,000, which would fall outside of the most common prices.